
 1 hour ago
5
1 hour ago
5 
TLDR
Solana is testing key support near $73, close to the 0.382 Fibonacci retracement at $73.89 A recovery above $77 would put SOL back above descending resistance and open the door to $80-$84 Losing $73 could expose the $68-$64 region, with the June low near $60 below that Analyst Crypto Patel identifies $52-$73 as a long-term accumulation zone on the weekly chart Long-term price targets of $500 and $1,000 are on the chart, but depend on multiple major breakoutsSolana is sitting at a key level right now. The price is hovering near $73.90, just above the 0.382 Fibonacci retracement at $73.89 and an ascending trendline that has held since June.
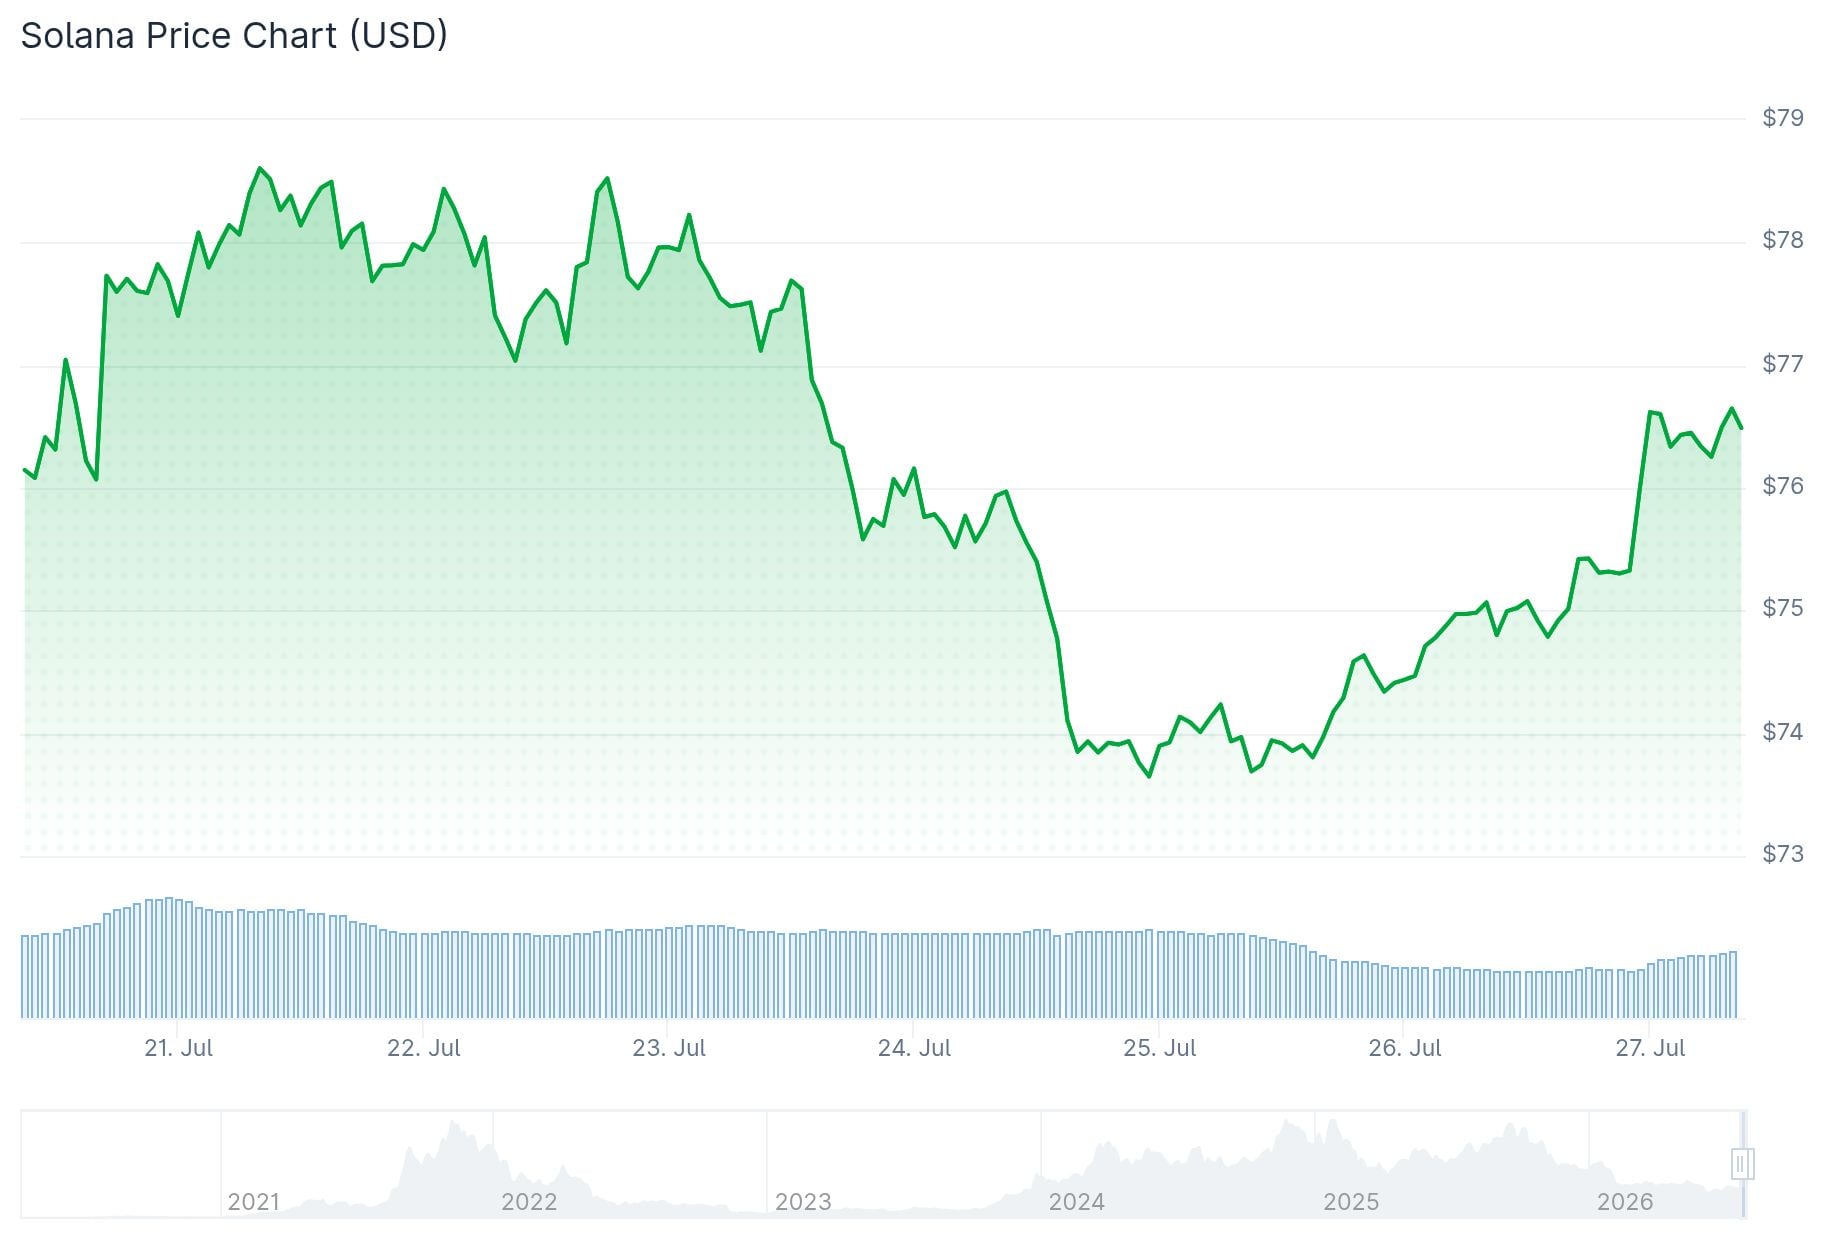 Solana (SOL) Price
Analyst Crypto Patel has been watching this level closely. He says holding $73 keeps the bullish structure intact, while a breakdown could drag the price into the $68-$64 liquidity zone.
Buyers have defended this rising trendline multiple times during the recovery. That history gives the support some weight, but Solana still has work to do on the upside.
$SOL looks ready. 🚀
Needs to hold $75.06 into the daily/weekly close. Do that, and we have a clean deviation.
Given the look and early break on $SOL / $BTC, I wouldn't be surprised to see SOL run back to $84, possibly the $90 imbalance from May. pic.twitter.com/gqFqj4rN1P
— Justin Bennett (@JustinBennettFX) July 26, 2026
SOL is currently trading below a descending resistance line that runs from the July high near $84. That overhead pressure is limiting short-term recovery attempts.
The $77 Level to Watch
A move back above $77 would put Solana back above that resistance line. From there, the next targets are $80 and $84.
If $73 breaks, the next support is the 0.5 Fibonacci level near $71. Below that, the $68.22-$64.46 zone becomes relevant, and a break under $64.46 could take the price back toward the June low around $60.
Crypto Patel also shared a weekly chart showing a much bigger picture. On that timeframe, SOL is sitting near $74, just above Fibonacci support around $72.55, with a broader support zone extending down to roughly $52.
$SOL Is Sitting At The Most Important Level Of This Cycle#SOL is trading inside a high-confluence HTF demand zone where the previous breakout base, weekly support, and the 0.618 Fibonacci retracement all intersect.
This is the market's decision point.
▶️ Hold $73 → Bullish… pic.twitter.com/3yJsuPBj1B
— Crypto Patel (@CryptoPatel) July 25, 2026
Holding anywhere in the $52-$73 range would keep the long-term bullish setup in play. A sustained break below $52 could bring $32.50 into the picture.
Long-Term Targets at $500 and $1,000
On the weekly chart, Crypto Patel projects potential targets at $500 and $1,000 if SOL completes a full breakout cycle.
The first major hurdle is $101. After that, Solana would face resistance between $180 and $295, which includes the area around its previous all-time high.
Only a confirmed breakout above that zone would bring the $500 target into view. The $1,000 level would represent a gain of roughly 1,900% from the lower support zone.
These targets are based on Solana repeating a previous breakout-and-retest structure. At current prices near $73-$74, SOL remains in the support phase, not a confirmed expansion.
The most recent data places Solana near $73.90 with the short-term decision point centered on whether buyers can hold the $73 level through current pressure.
The post Solana (SOL) Price: SOL Is at a Decision Point — Here’s the Bull Case and the Bear Case appeared first on CoinCentral.





 Bengali (Bangladesh) ·
  English (United States) ·